Article · · 7 min read
Kessler Syndrome, Explained Without the Movie Version
What Kessler and Cour-Palais actually predicted in 1978, why a debris cascade unfolds over decades rather than minutes, and where low Earth orbit sits on that curve today.
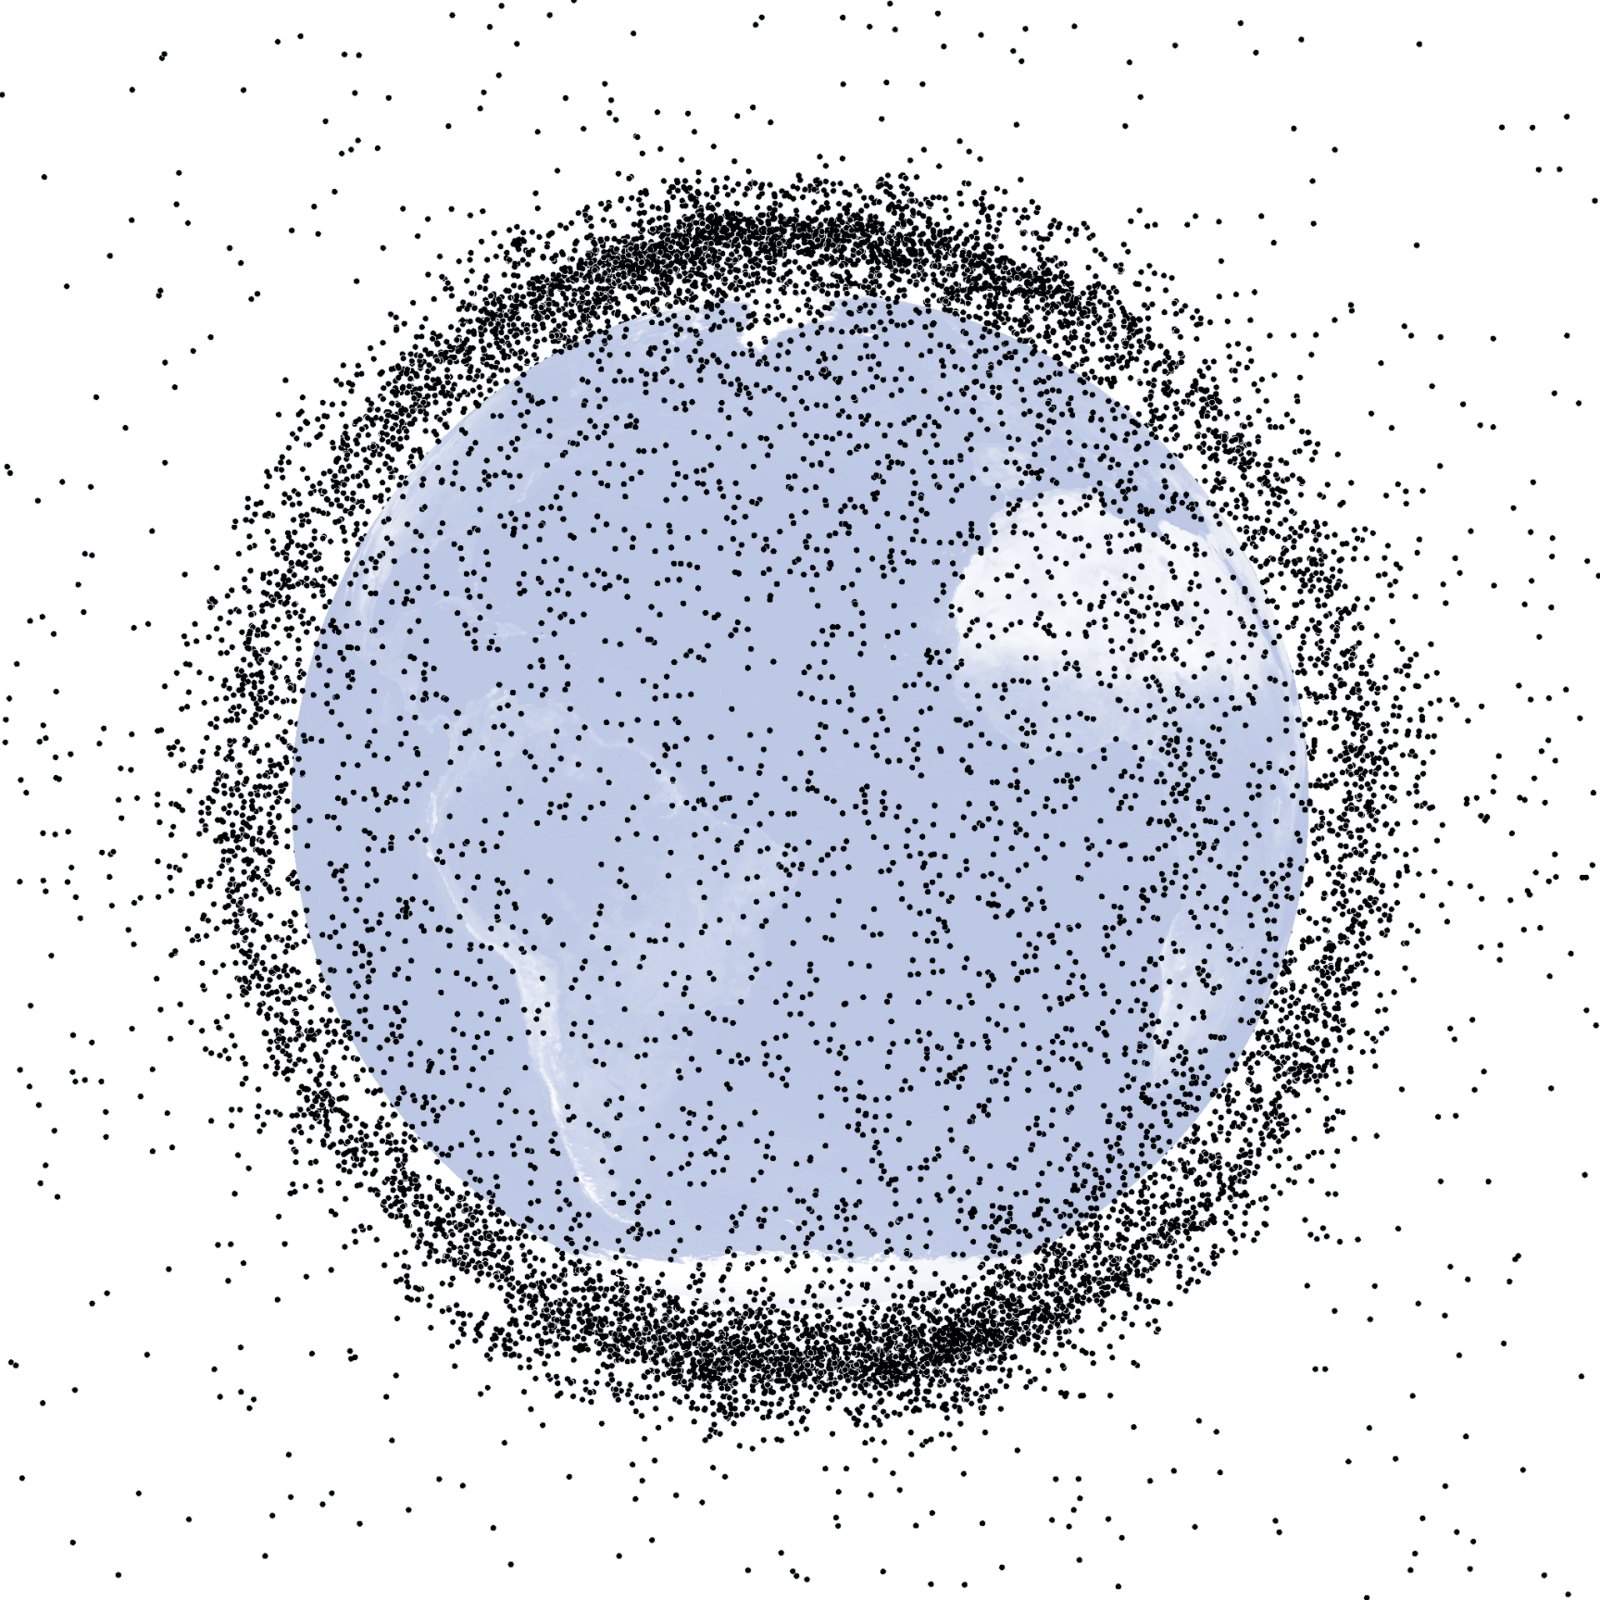
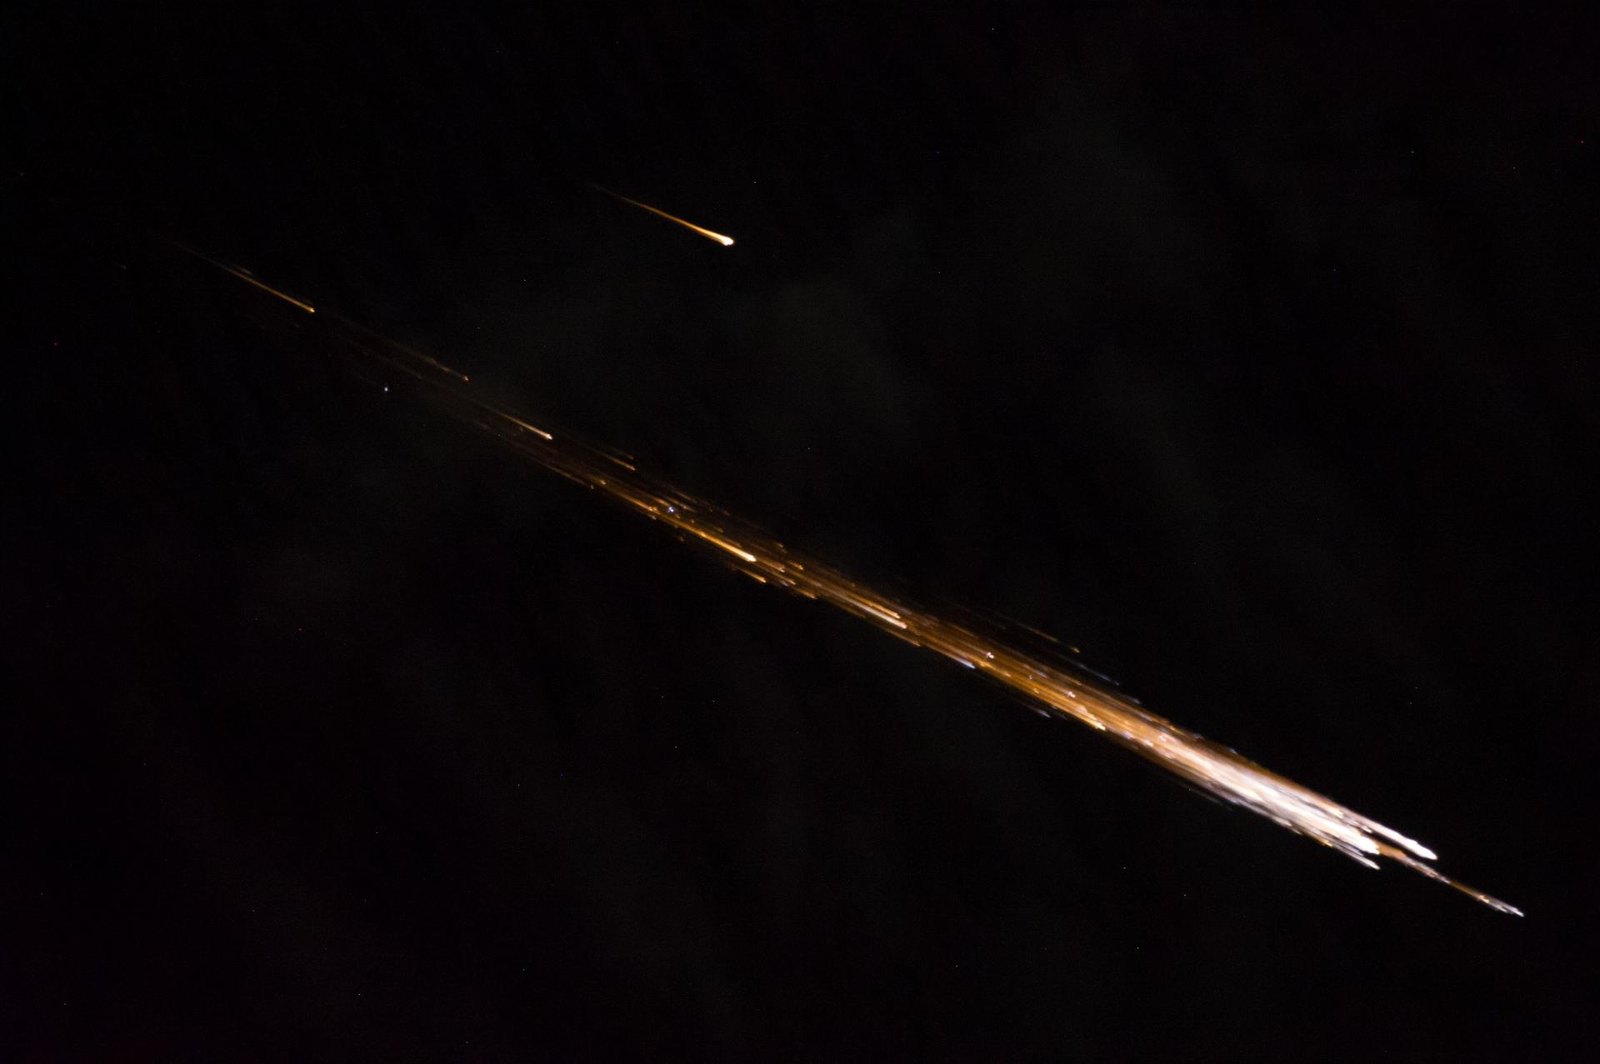
Say "Kessler syndrome" and many people picture a film scene: one explosion, a wall of shrapnel sweeping around the planet, every satellite gone in an afternoon. The real idea is less cinematic and more worrying, because it does not need a single dramatic moment to happen. It only needs time.
The 1978 paper
In June 1978, Donald J. Kessler and Burton G. Cour-Palais published "Collision Frequency of Artificial Satellites: The Creation of a Debris Belt" in the Journal of Geophysical Research JGR, Kessler & Cour-Palais 1978. At the time, the concern about objects in space was mostly about natural meteoroids. Kessler and Cour-Palais asked a different question: as the number of artificial satellites grows, how often will they hit each other, and what happens to the pieces?
Their answer was that collisions would create fragments, fragments would raise the probability of further collisions, and at some density the process would sustain itself. The paper warned that "the belt could begin to form within this century" and that the flux of artificial debris "could exceed the natural meteoroid flux" Kessler & Cour-Palais, full text. The full paper is freely readable, and it is worth the time; the core reasoning fits in a few pages NASA ADS. Kessler has since reflected on how the idea was received and later misread in an interview with Aerospace America.
What a cascade actually is
The key concept is a threshold. Below it, debris generated by collisions is removed by atmospheric drag faster than new collisions create more. Above it, the collision rate grows on its own even if nobody launches anything else.
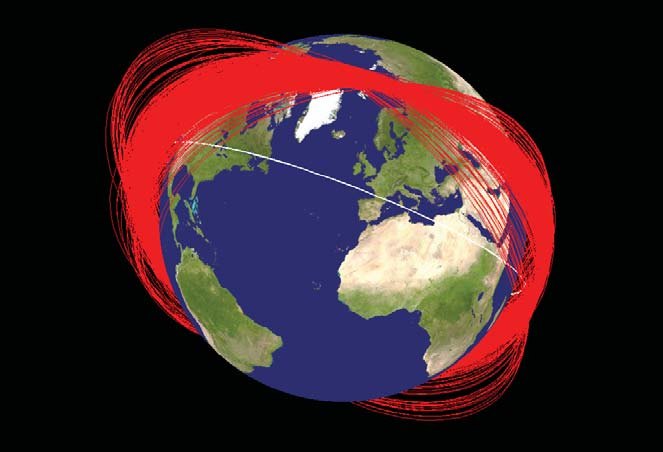
Three physical facts drive the process.
First, speed. Objects in LEO move at 7 to 8 km/s and the average impact happens at about 10 km/s NASA ODPO FAQ. At that speed, a collision does not dent a satellite; it shatters it.
Second, fragment counts. When the active Iridium 33 hit the derelict Cosmos 2251 at more than 11 km/s at 790 km in February 2009, 823 pieces had been catalogued by the end of March NASA ODQN v13 i2. By January 2013 the catalogued count had grown to 598 for Iridium 33 and 1,603 for Cosmos 2251 NASA NTRS. One collision between two objects of about half a tonne and one tonne produced more than 2,000 trackable fragments, and far more that were too small to track.
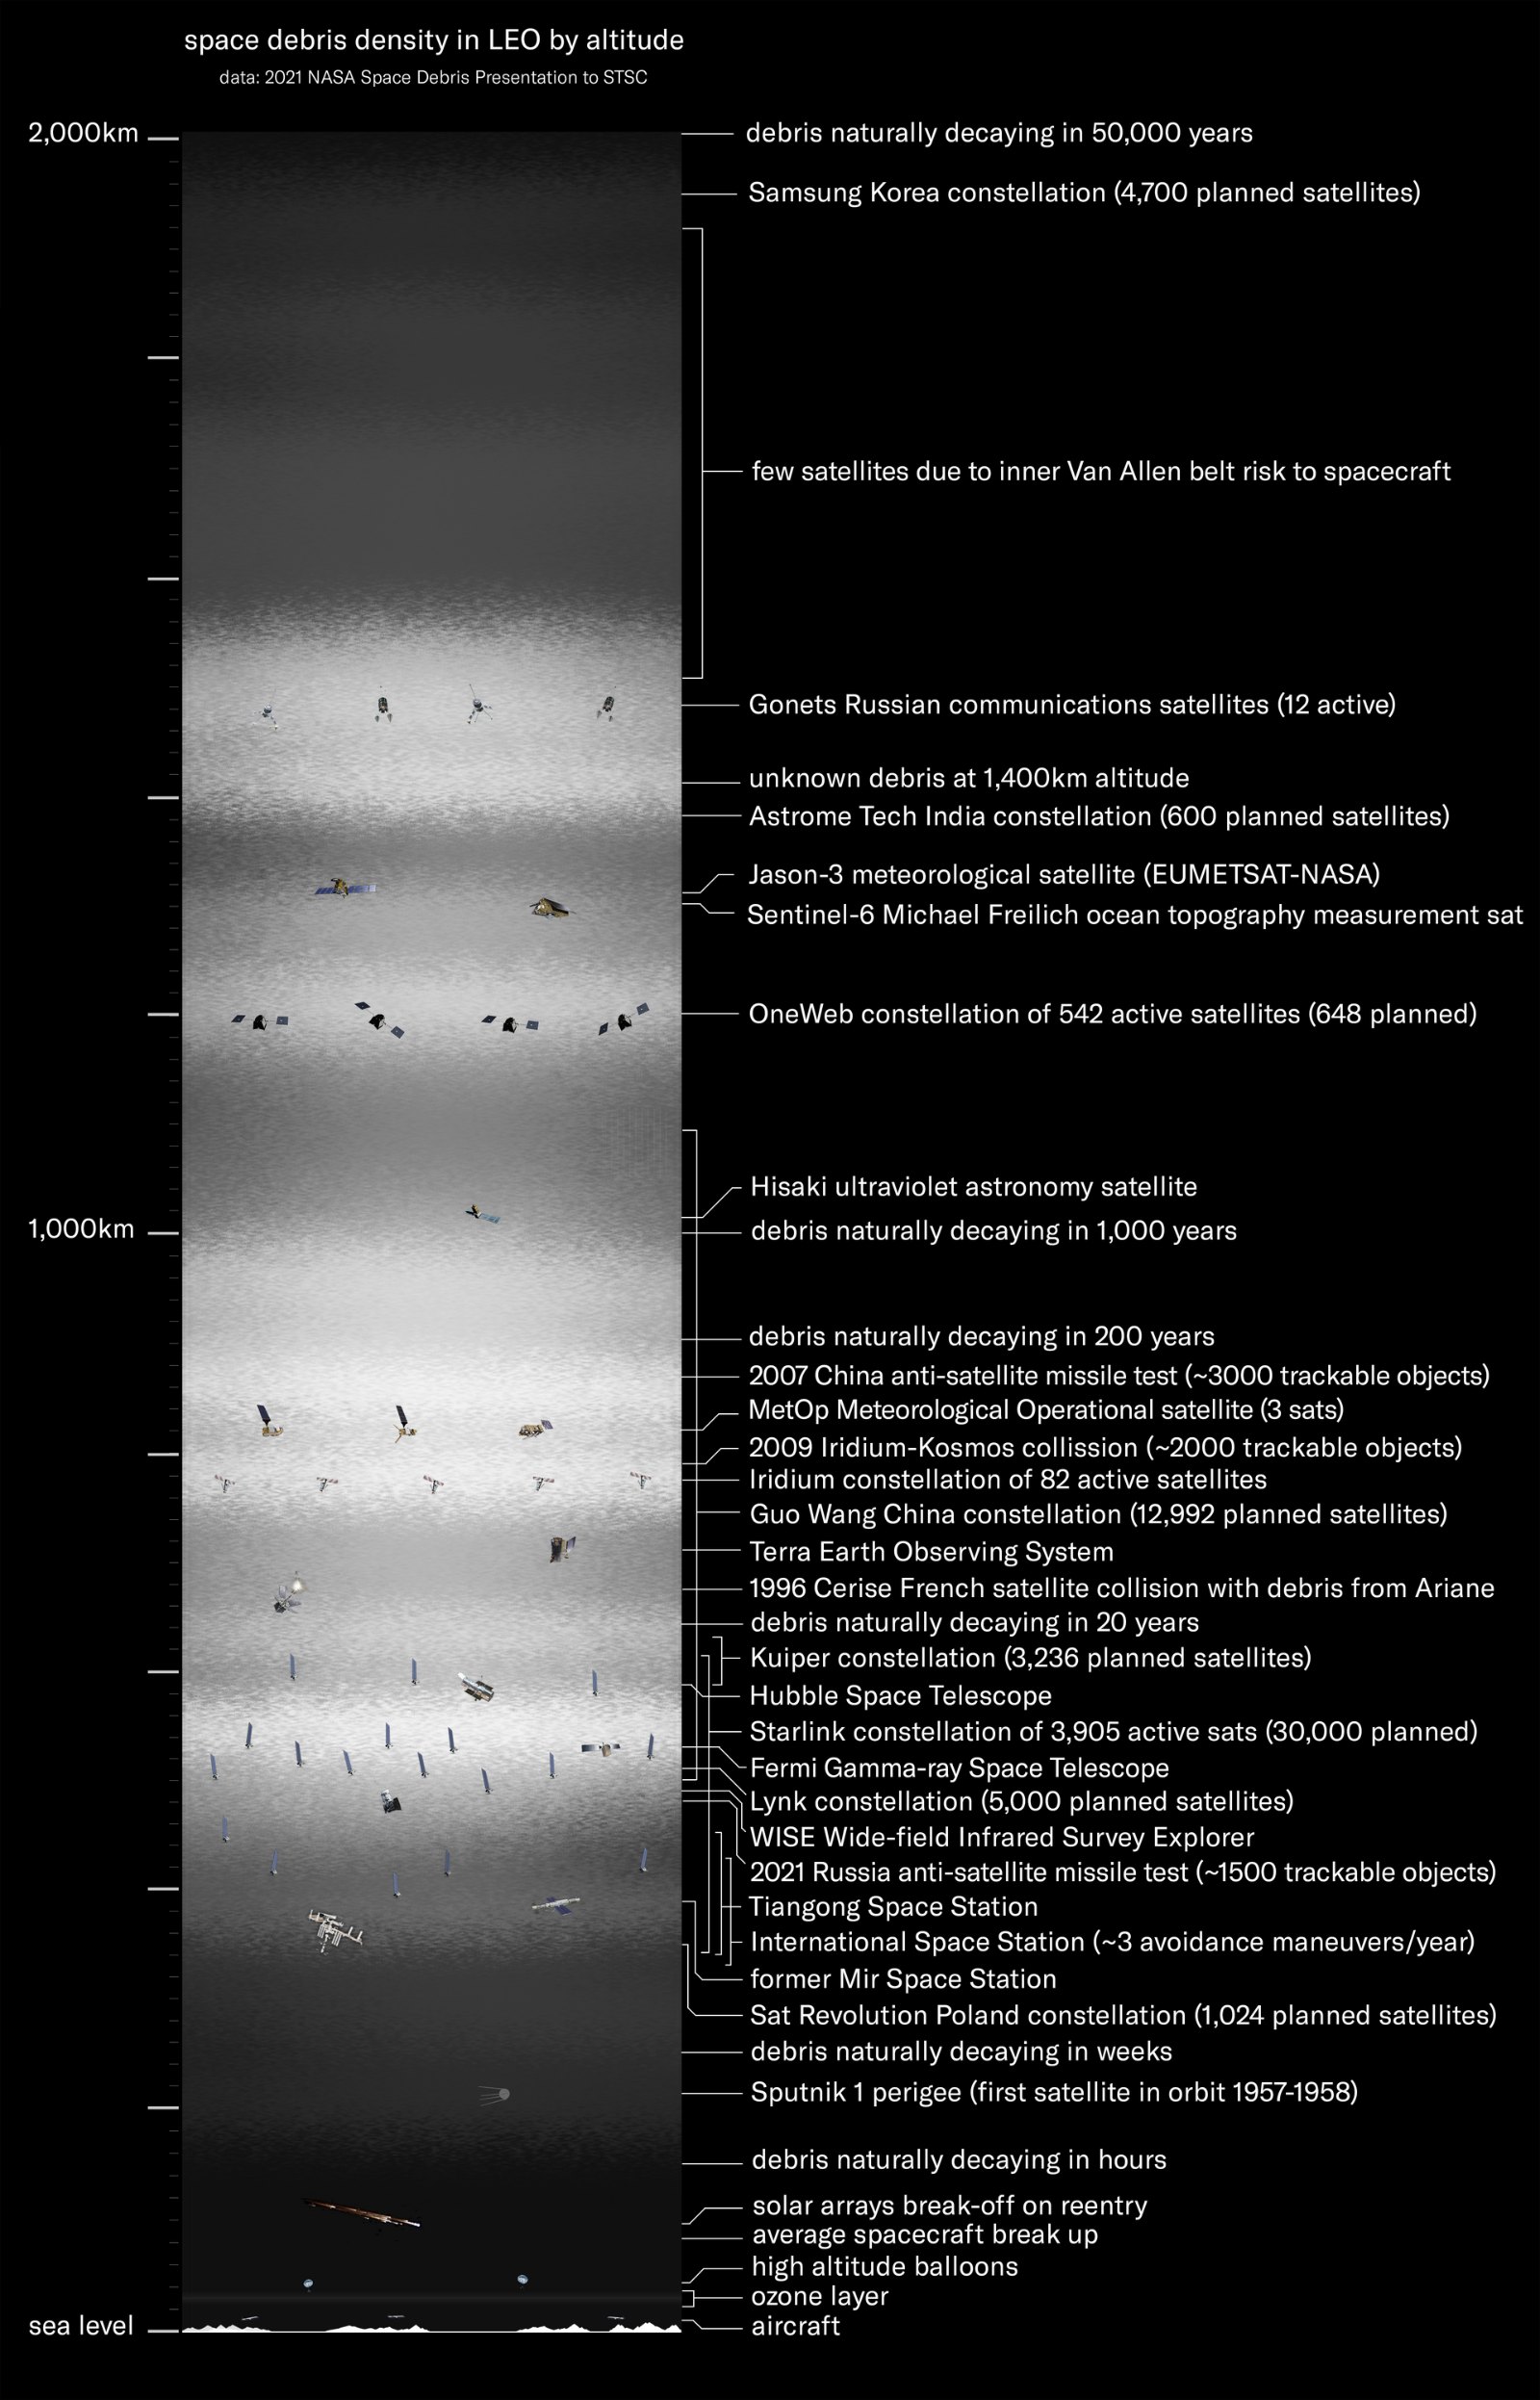
Third, lifetime. Drag is what eventually cleans orbit, and drag fades quickly with altitude. A rough rule of thumb puts orbital lifetime at around 10 years at 500 km, around 100 years at 700 km and around 1,000 years at 900 km Space Academy. NASA puts it more bluntly: at about 800 km, decay "is often measured in centuries" NASA ODPO FAQ. Fragments released at those altitudes are not a passing hazard. They stay.
Put those together and you get the cascade. It is not a chain reaction in the explosive sense. It is a slowly rising collision rate in particular altitude bands, where each event loads the band with long-lived fragments that raise the odds of the next event. The time between collisions shrinks over years and decades, not minutes.
Why "slow" is not reassuring
The slowness cuts both ways. It means no one will wake up to find LEO unusable. It also means the process can pass the point of no return without any visible catastrophe, because the decisive change is statistical. By the time collisions are frequent enough to be obvious, the debris that will cause the next several decades of collisions is already in orbit.
It also means deliberate events matter enormously. China's 2007 anti-satellite test destroyed the Fengyun-1C weather satellite at around 850 km; NASA called it "the single worst contamination of LEO during the past 50 years," with more than 1,200 fragments catalogued within two months and up to around 35,000 pieces of 1 cm or larger estimated NASA ODQN v11 i2. Nearly two decades on, many of those fragments are still there.
Where low Earth orbit sits on the curve
No one can point to a single date and say the threshold was crossed. What is possible is to read the trend lines published by the agencies that model the environment.
ESA counts more than 660 fragmentation events since 1957 ESA DISCOS statistics, with an average of 9.8 non-deliberate fragmentations per year over the last two decades ESA Report I10R1. Its 2026 environmental health index projects long-term risk in the business-as-usual case at "50 times higher than this acceptable first target threshold" ESA Report I10R1.
Most strikingly, ESA now uses Kessler's own framing: "The expected number of objects and collisions in LEO are skyrocketing in a runaway effect" ESA Space Environment Report 2026. That is a space agency, not a commentator, describing the projected environment as self-reinforcing.
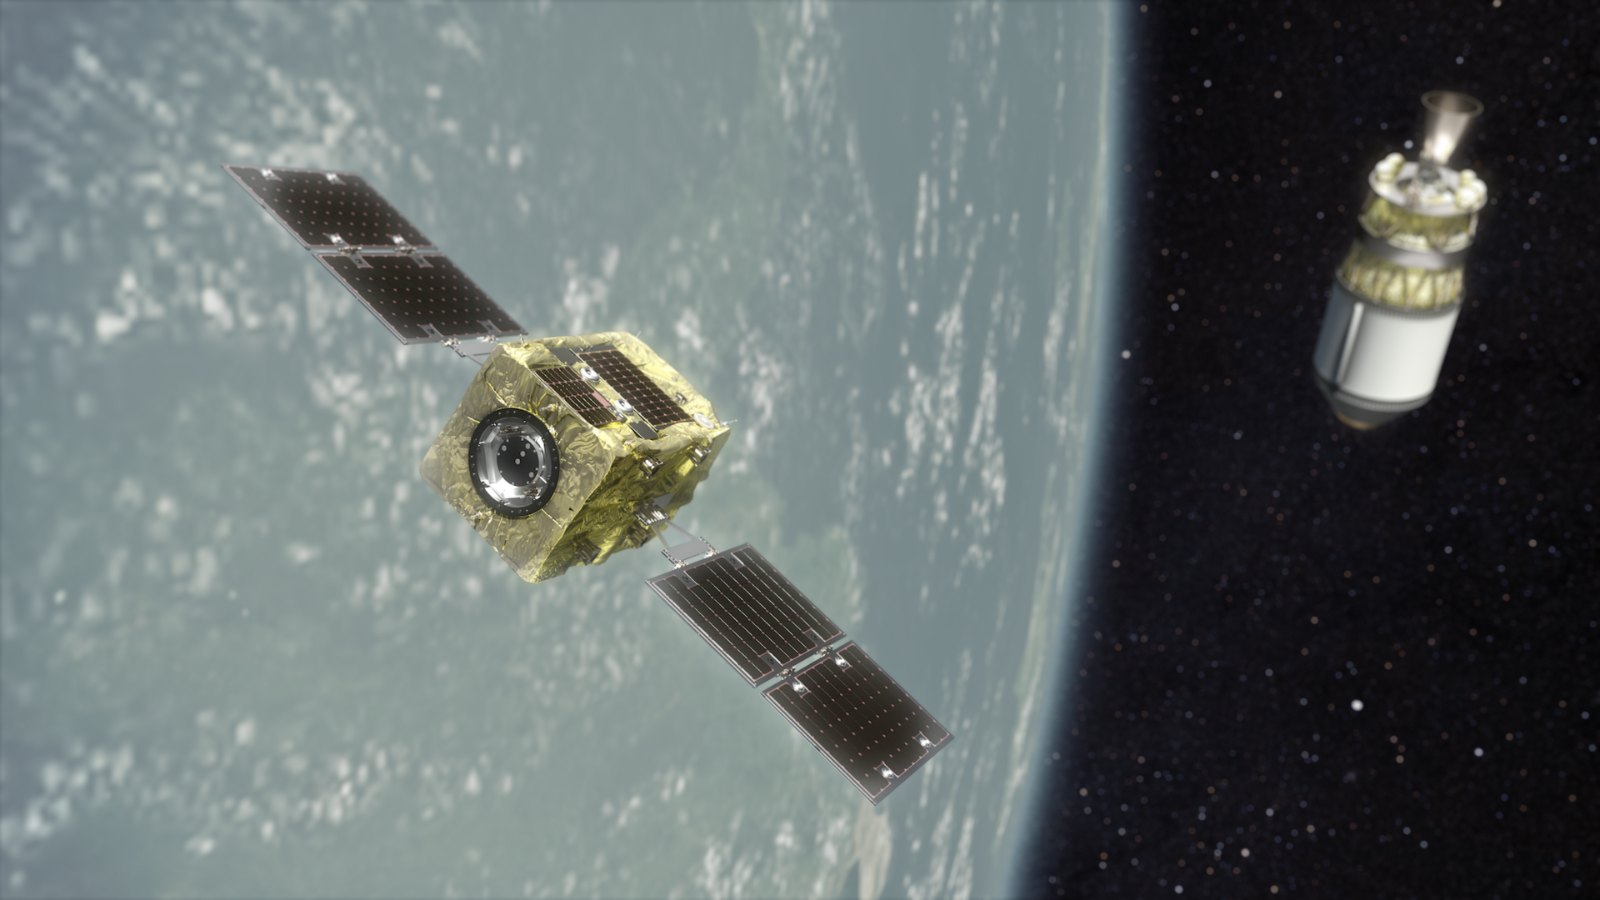
The strongest quantitative guidance on how to bend the curve is older. A NASA Orbital Debris Program Office study found that "in order to maintain the LEO debris population at a constant level for the next 200 years, an active debris removal of about five objects per year is needed," with targets ranked by mass times collision probability Liou, NASA NTRS. That study assumed about 90% compliance with disposal rules, well above what ESA currently observes, and it predates the constellation era. "About five per year" is best read as a floor, not a target.
What the cascade is not
It is not uniform. The risk concentrates in specific altitude and inclination bands where massive derelicts sit close together, such as the cluster of Soviet-era Zenit-2 rocket stages near 830 to 850 km and 71 degrees inclination McKnight et al. 2021. It is not instantaneous. And it is not irreversible in the short term: removing the right handful of massive objects removes the raw material for the worst future collisions, which is why the targets matter as much as the number.
ClearOrbit's view
We think Kessler's idea has been done a disservice by its dramatic retellings. Framed as a sudden apocalypse, it invites either panic or dismissal. Framed accurately, as a slow rise in collision rate driven by long-lived mass in crowded bands, it points directly at what to do: stop adding long-lived mass, and start removing the mass already there.
ESA's use of the phrase "runaway effect" in 2026 should end the debate about whether this is a real concern. The open question is whether the response keeps pace. We want the public conversation to move from "will it happen?" to "which objects, how many per year, and who pays?"
Our view is that the first removals should target the objects with the greatest mass in the most congested bands, that just-in-time nudging should be developed in parallel to prevent the next big collision, and that every mission should report its outcome publicly so the curve can be tracked honestly. That is the logic behind the priorities in the ClearOrbit plan.
Reader mail
Have a better idea?Spotted something we got wrong?
We publish in public so the numbers can be checked. If a figure looks wrong, a source is missing, or you know something this piece should have said, send it over. One box, no sign-up.
Send an idea or correctionQuick question
Who should pay for cleaning up orbit?
Anonymous. You will see how others answered after you vote.
Sources
- Kessler & Cour-Palais (1978), JGR publisher page
- Kessler & Cour-Palais (1978), NASA ADS
- Kessler & Cour-Palais (1978), full text scan
- A conversation with Donald Kessler, Aerospace America
- ESA Space Environment Report 2026
- ESA Space Environment Report, Issue 10 Rev 1 (PDF)
- NASA ODQN v13 i2 (Iridium-Cosmos collision)
- NASA ODQN v11 i2 (Fengyun-1C)
- NASA NTRS fragment status 2013
- NASA ODPO FAQ
- Space Academy, orbital lifetimes
- Liou, NASA ODPO ADR study
- ESA DISCOS statistics
- McKnight et al. (2021), 50 statistically-most-concerning derelicts