Article · · 7 min read
The State of Orbit, 2026
A readable digest of ESA's Space Environment Report 2026 and the numbers behind it: a record catalog, a crowded model, daily re-entries and a health index 50 times over target.
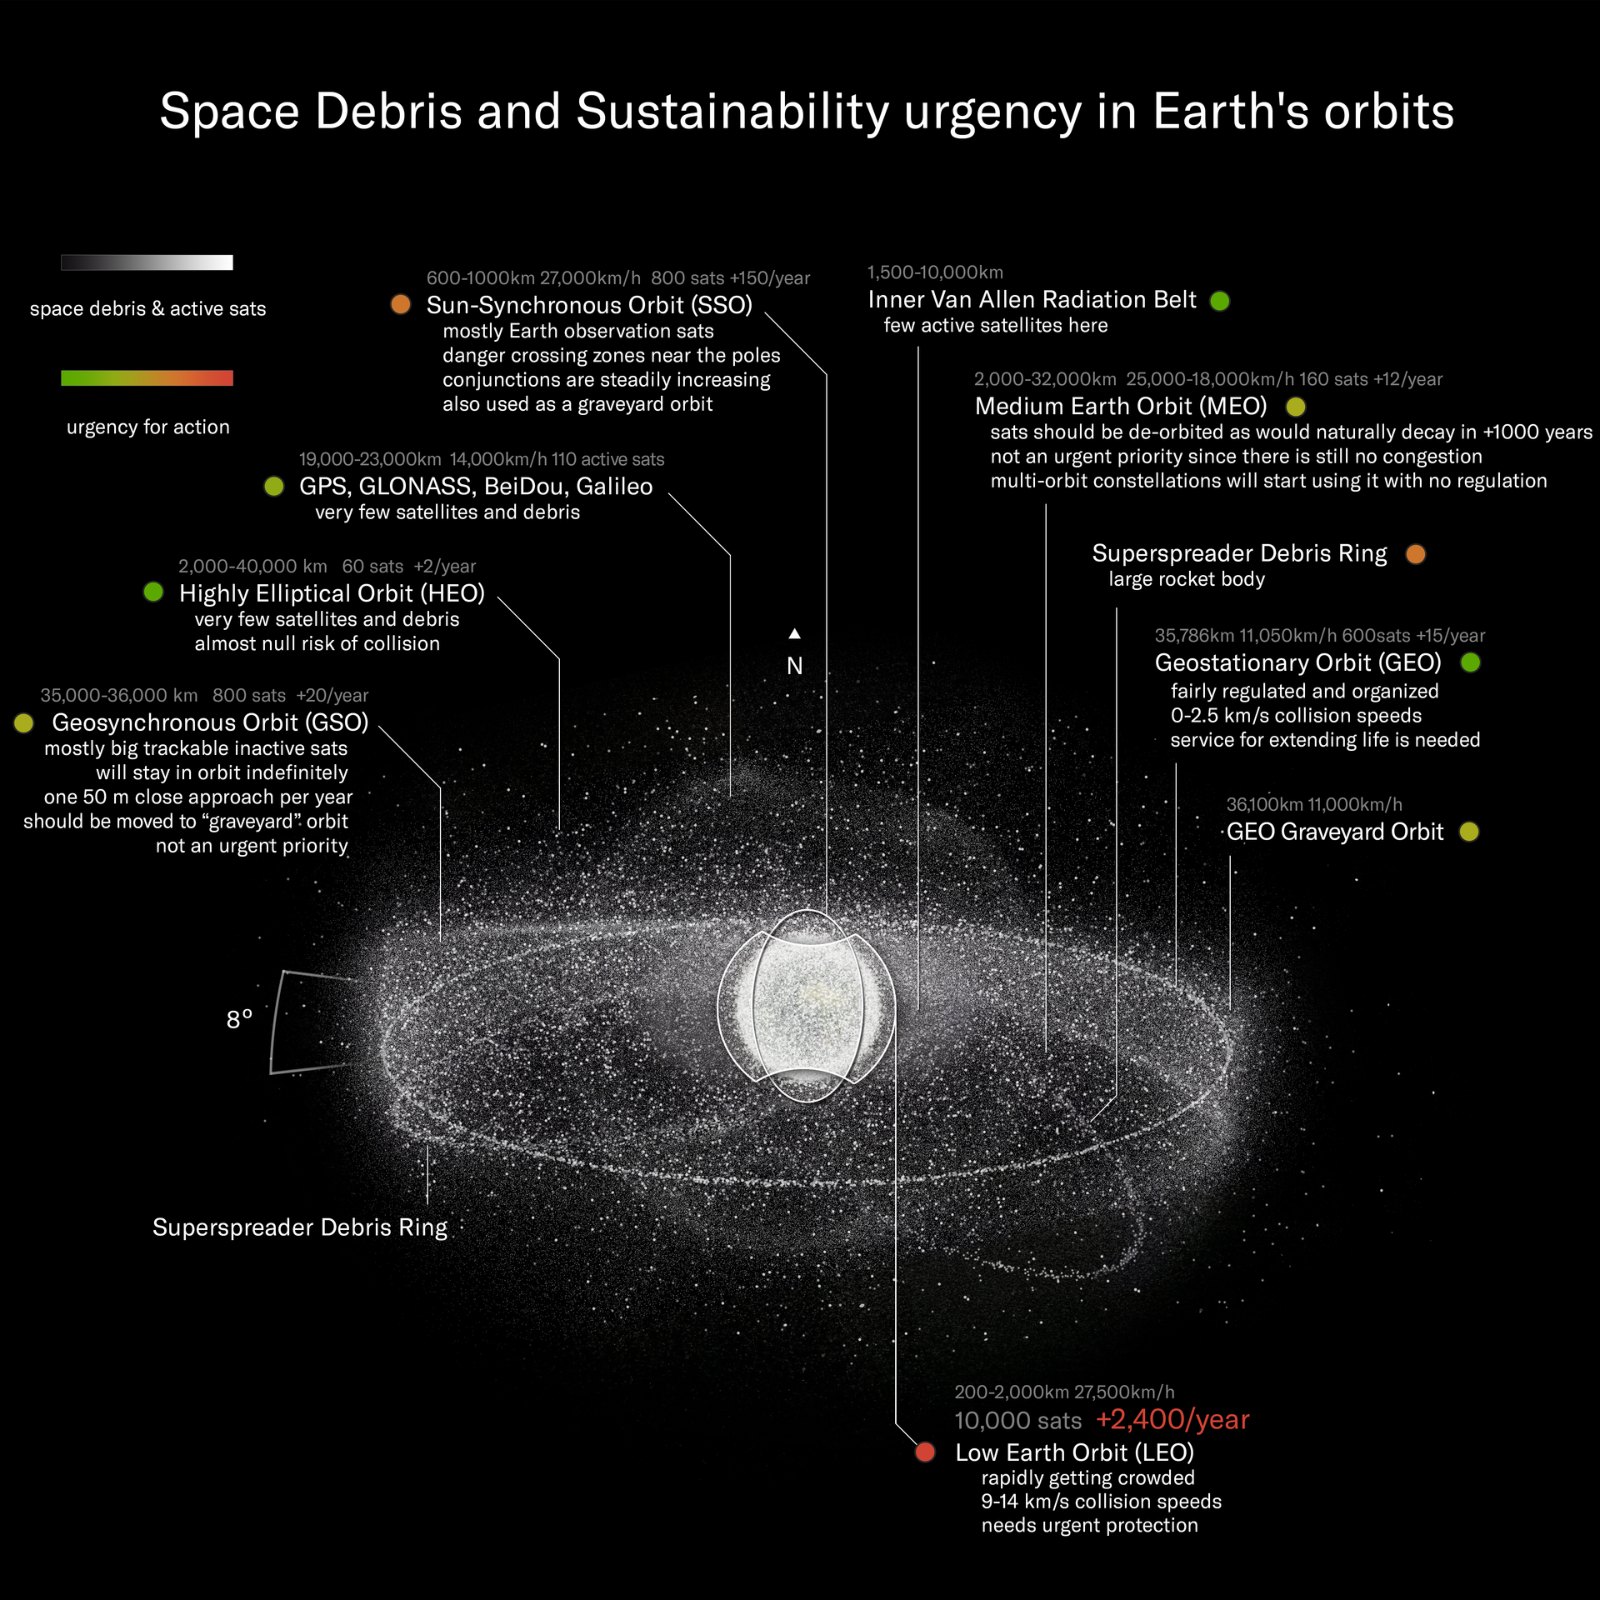
Every September, the European Space Agency publishes the closest thing orbit has to an annual physical exam. The 2026 edition of the Space Environment Report, released on 14 September with data running to the end of 2025, is the tenth in the series and the most sobering yet ESA Space Environment Report 2026. This digest walks through what it says, what the surrounding catalogs show, and how to read numbers that different organizations count in different ways.
A year of record traffic
The headline is volume. In 2025 the world flew more than 300 launches and placed more than 4,000 new payloads in orbit, about ten new satellites every day ESA Space Environment Report 2026. Most of that growth is in low Earth orbit (LEO), and most of it belongs to a handful of constellations.
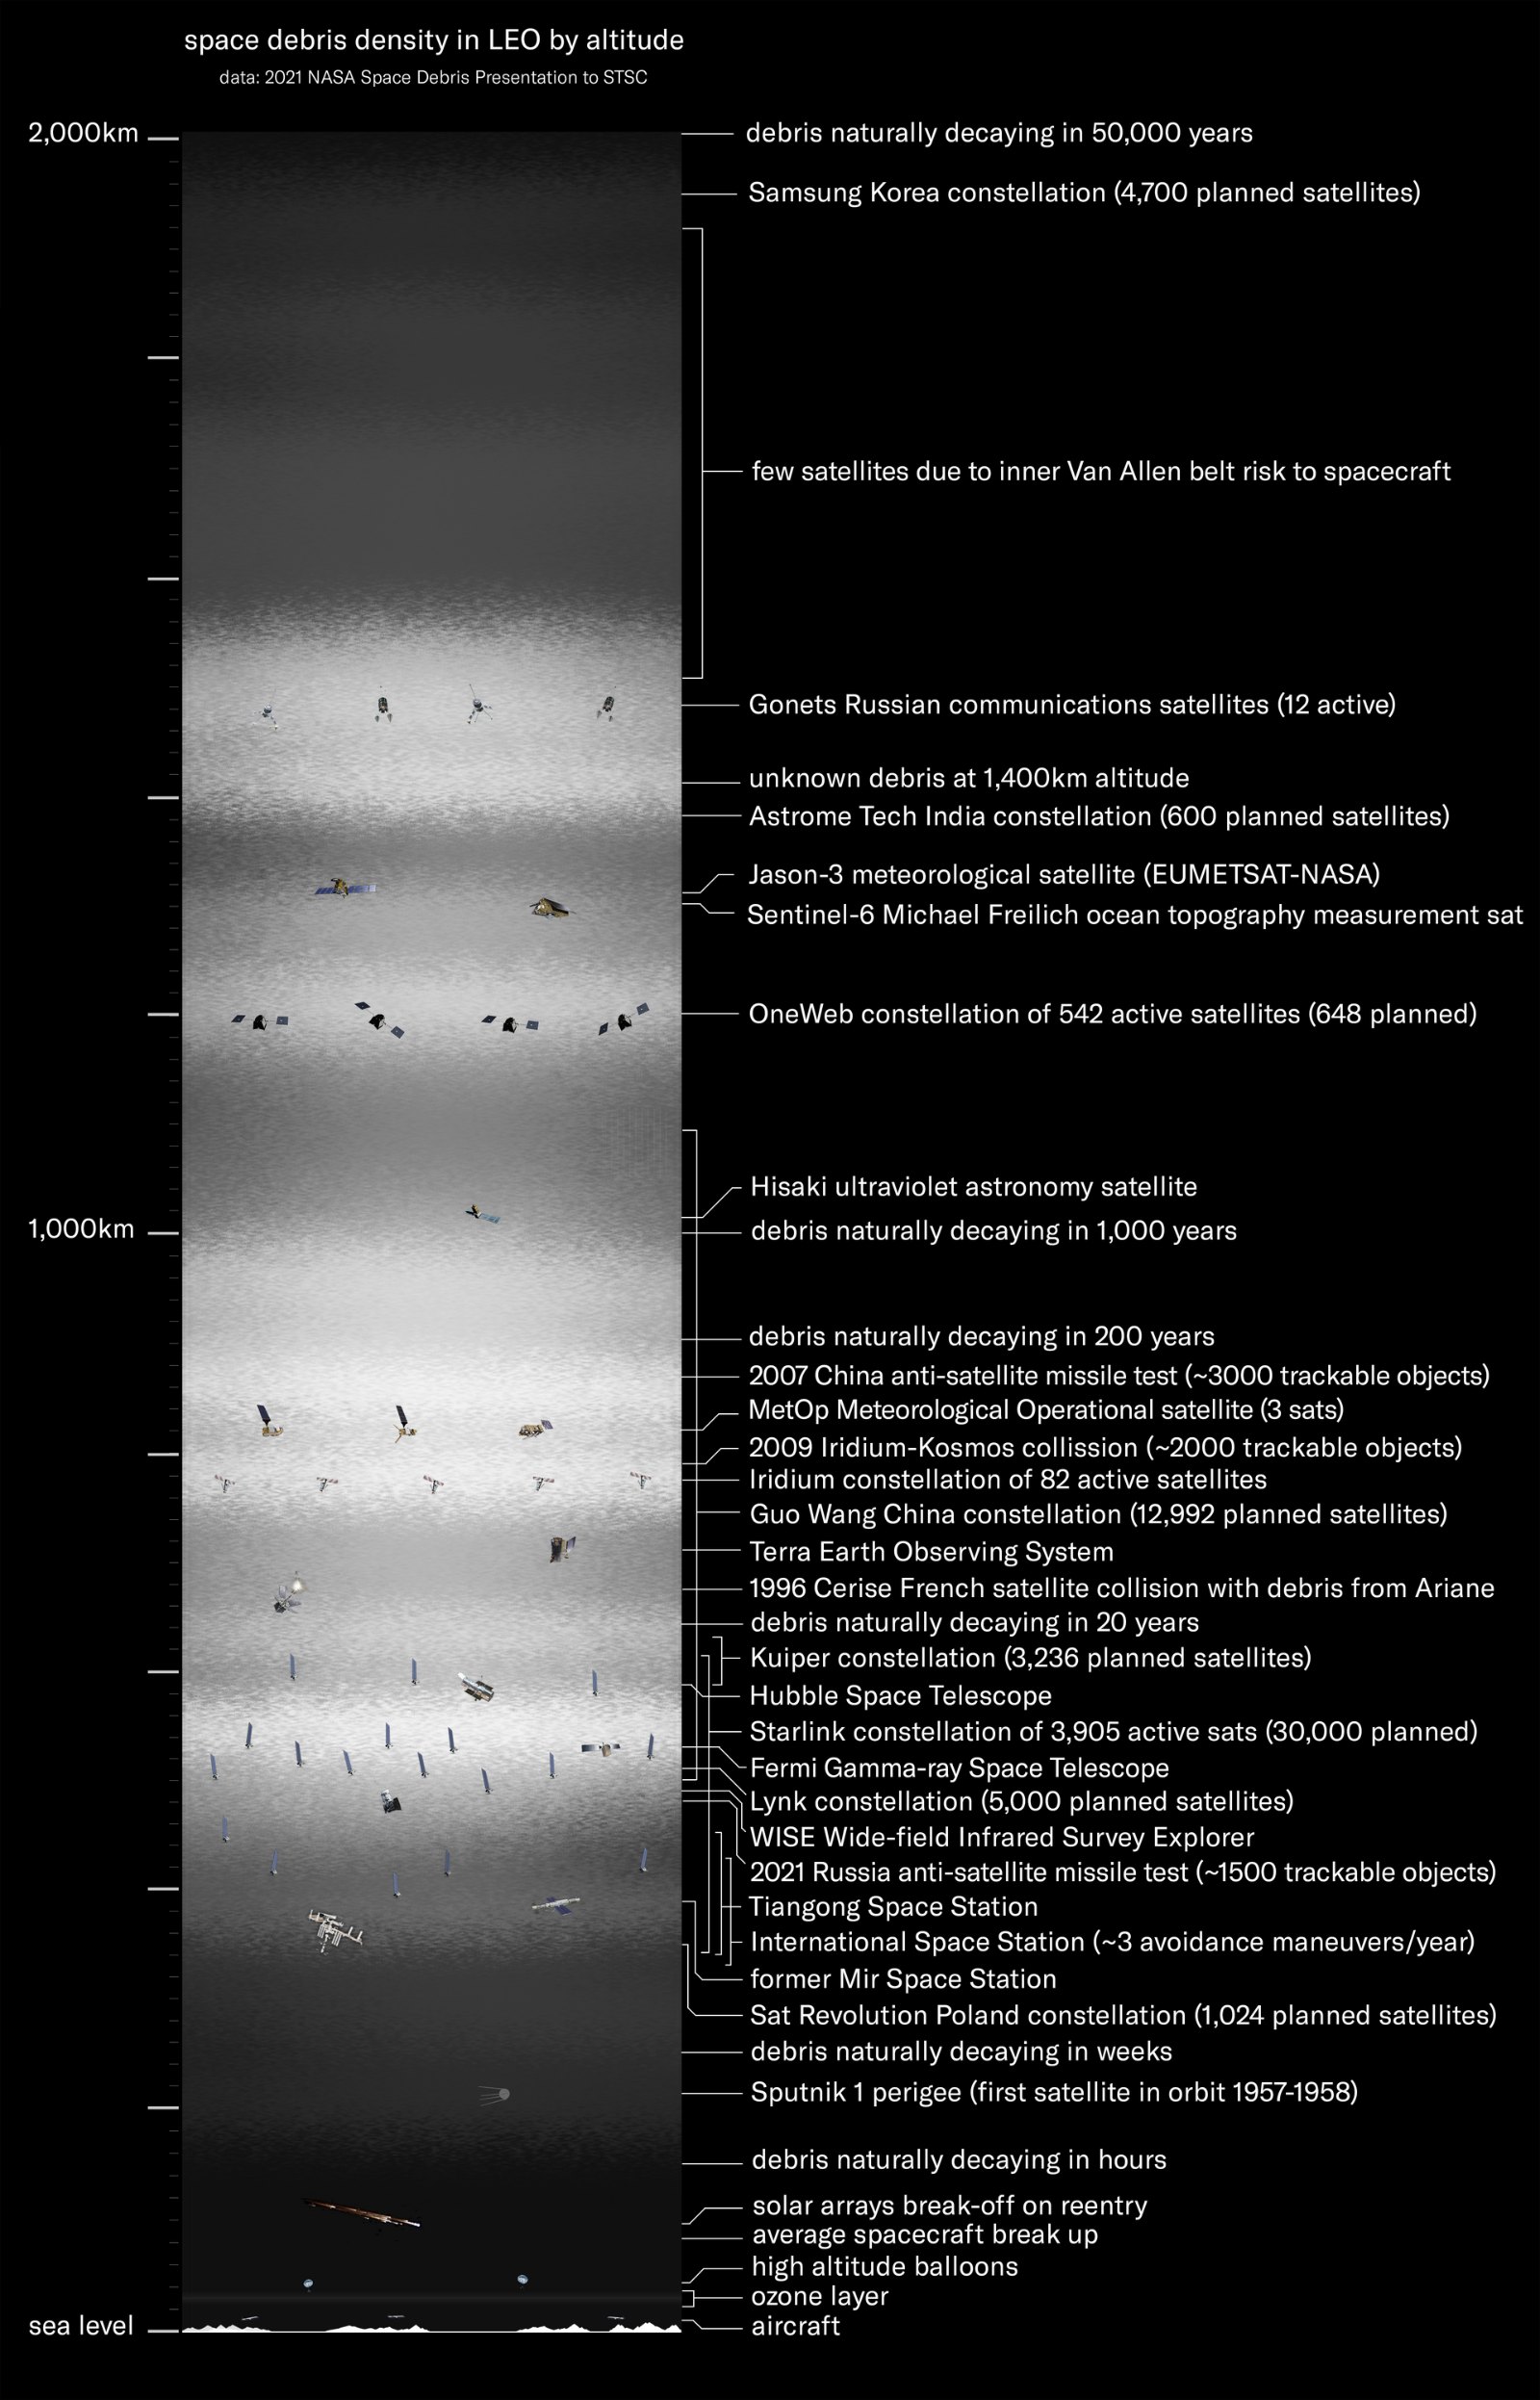
Jonathan McDowell's running tally shows SpaceX has launched 12,935 Starlink satellites, of which 11,127 are still in orbit and 9,713 are in their operational shells McDowell, Starlink statistics. Behind Starlink come Eutelsat OneWeb with 636 operational satellites, Amazon's Kuiper (now branded Amazon Leo) with 320, and two Chinese systems, Qianfan with 177 and Guowang with 211 McDowell, constellation list. Those numbers move weekly, so treat them as a snapshot. The filings are larger still: tens of thousands of planned Starlinks, 16,000 for Qianfan and nearly 14,000 for Guowang, plus paper constellations as large as 100,000 satellites McDowell, constellation list.
Counting what is up there
There is no single "number of objects in space." There are catalogs, which list objects someone has actually tracked, and models, which estimate populations too small to track one by one.
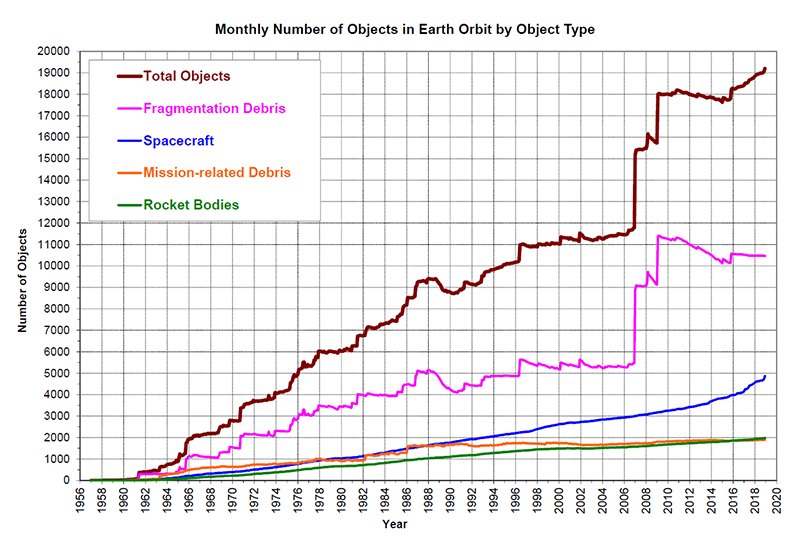
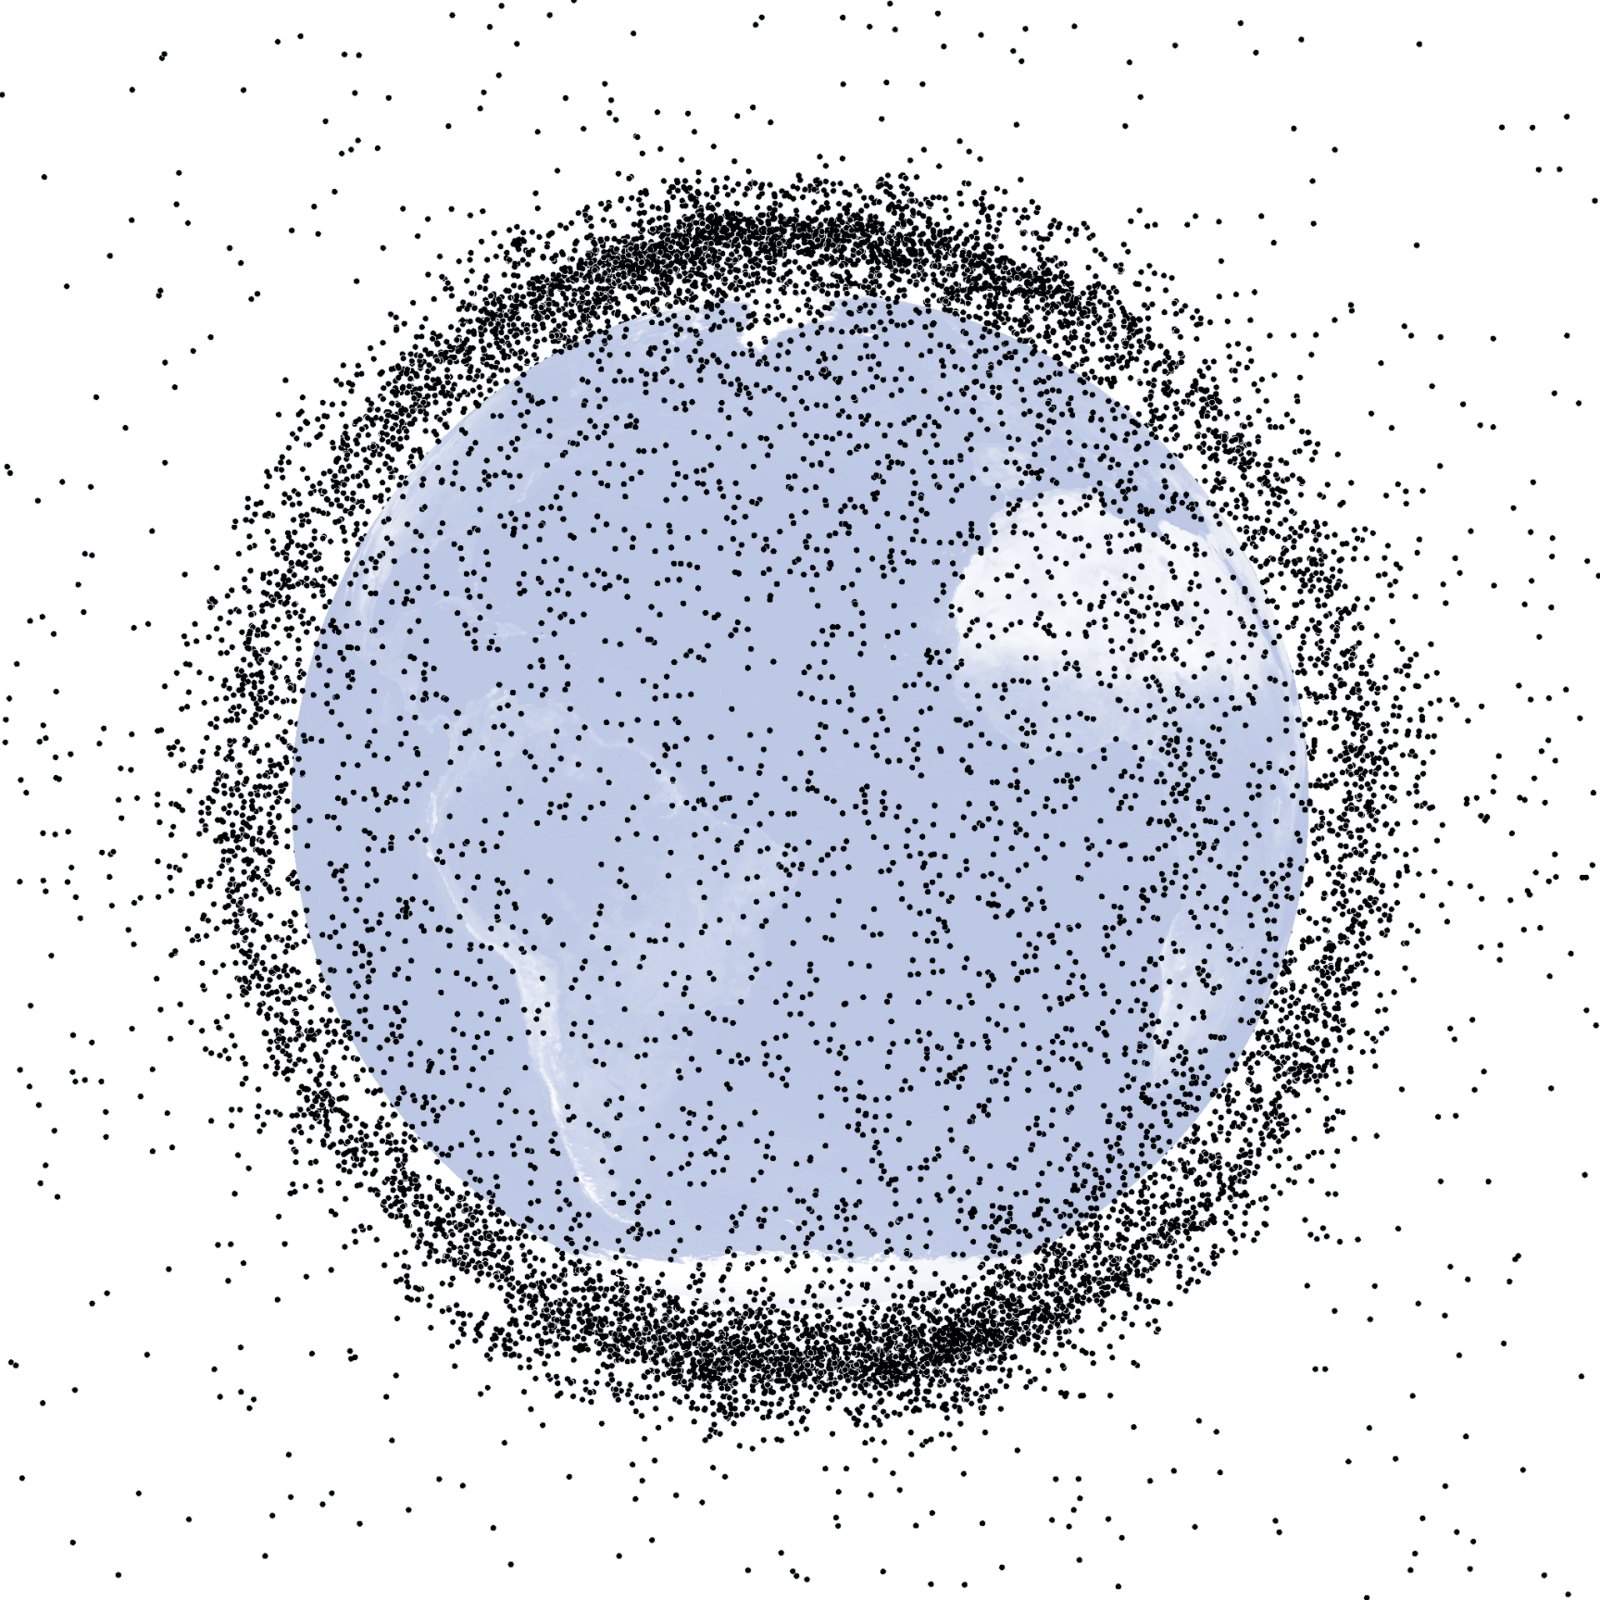
The public US Space Force catalog, as summarized by CelesTrak, listed 35,090 objects on orbit on 15 September 2026: 20,077 payloads and 15,013 pieces of debris and spent rocket bodies CelesTrak SATCAT Boxscore. Counting everything ever catalogued, including objects that have since fallen back, the total is 70,664 CelesTrak SATCAT Boxscore. NASA's Orbital Debris Program Office, using a slightly earlier cut-off of 3 May 2026, reported 33,098 catalogued objects on orbit NASA ODQN v30.
ESA's count is larger, about 46,860 tracked objects as of 31 July 2026, because it folds in objects seen by surveillance networks beyond the US public catalog ESA DISCOS statistics. The same page records more than 660 fragmentation events since 1957 and more than 17,000 tonnes of human-made mass in Earth orbit ESA DISCOS statistics. Of roughly 18,840 satellites still in space, about 16,000 are still working ESA DISCOS statistics.
The catalog also passed a symbolic milestone this summer. CelesTrak reports that the US catalog "ran out of 5-digit catalog numbers" with the addition of the Saramago satellite on 11 July 2026, and has since reached number 100691 CelesTrak NORAD elements. That matters beyond trivia: the decades-old two-line element format cannot represent objects numbered above 99,999, so any software still relying on it will quietly miss new objects CelesTrak GP data formats.
What the models say about what cannot be seen
Tracked objects are mostly larger than about 10 cm. Below that, estimates rely on statistical models. ESA's MASTER-8 model, in its February 2026 release, estimates 68,450 objects larger than 10 cm (of which about 11,300 are active payloads), roughly 1.5 million objects between 1 and 10 cm, and about 230 million between 1 mm and 1 cm ESA DISCOS, By the numbers.
Readers will see smaller figures elsewhere. NASA's FAQ page quotes more than 25,000 objects over 10 cm, about 500,000 between 1 and 10 cm, and over 100 million larger than 1 mm NASA ODPO FAQ. That page is older and uses a different model. Some press coverage of this year's report also repeats figures from an earlier ESA model release. MASTER-8 is the most recent primary estimate, which is why this site uses it and names the model every time.
Why care about a centimetre-sized fleck? Because in LEO objects travel at 7 to 8 km/s, and the average impact happens at around 10 km/s, occasionally up to 15 km/s NASA ODPO FAQ. At those speeds even centimetre-scale fragments can do serious damage, and objects that small are generally too small to track and warn operators about.
Things falling down
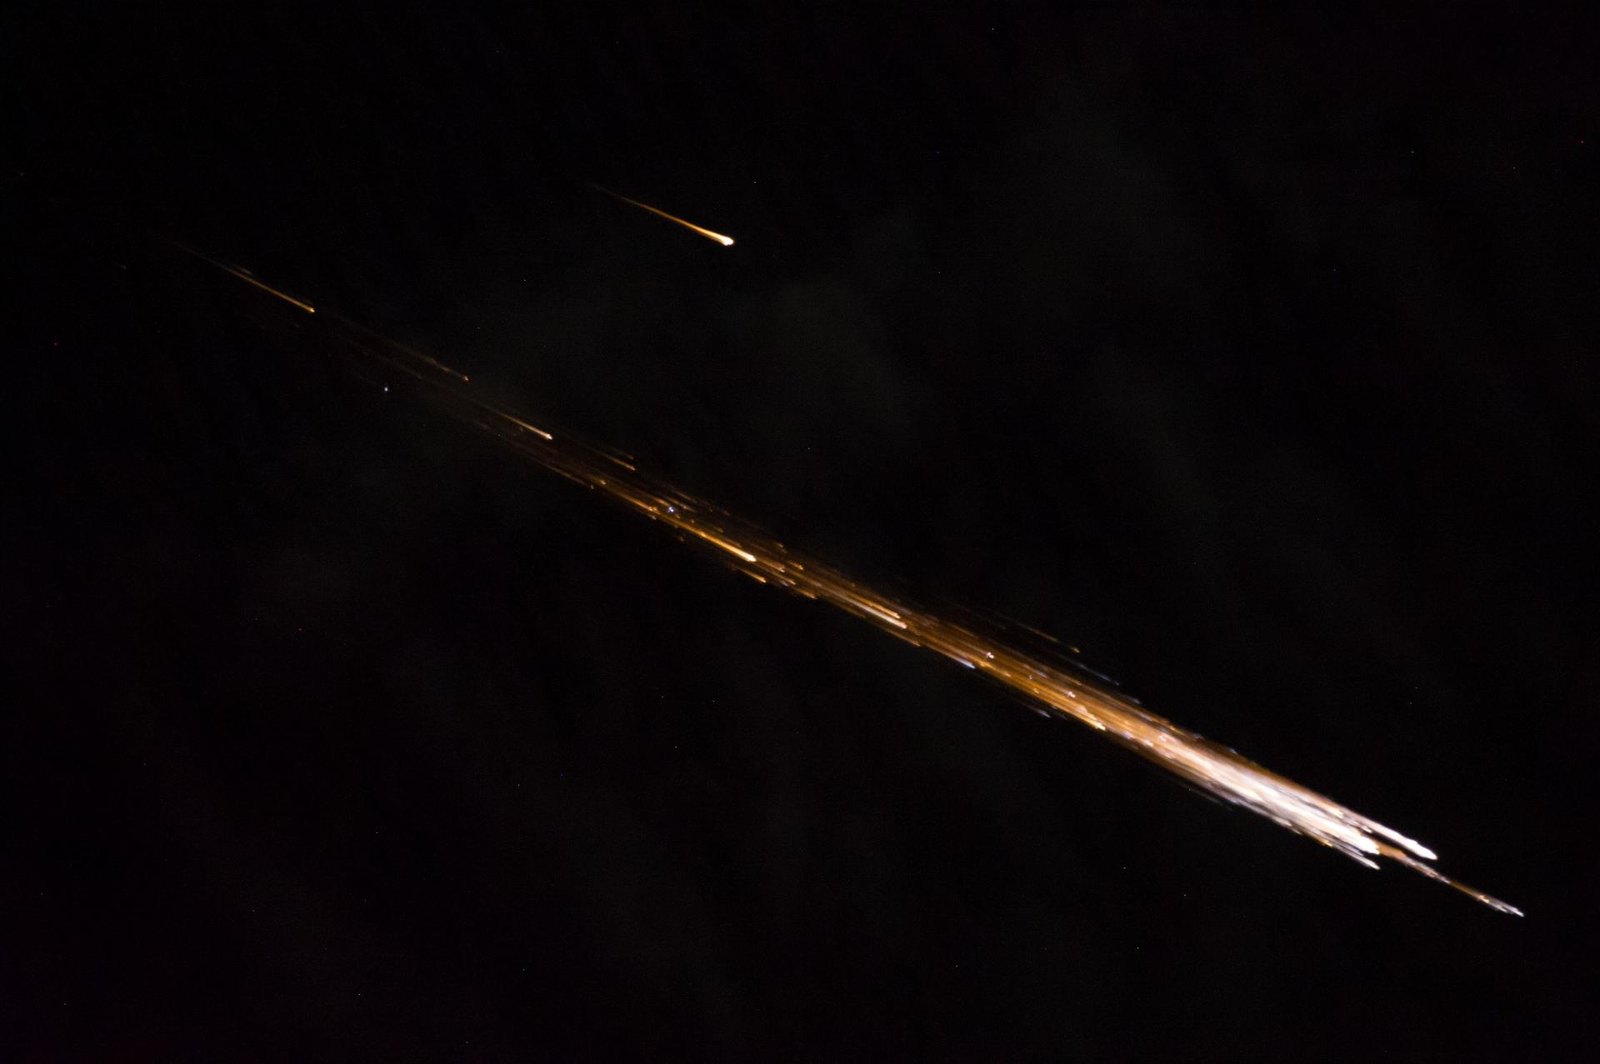
What goes up increasingly comes down on a schedule. ESA says "more than three intact satellites or rocket bodies" now re-enter the atmosphere every day ESA Space Environment Report 2026, about 1,200 intact objects over 2025 ESA Report I10R1. McDowell's figures show 1,808 Starlinks have already re-entered McDowell, Starlink statistics.
There is good news inside that trend. For the second year running, controlled re-entries of rocket bodies outnumbered uncontrolled ones, and the controlled share has climbed "from 10% to over 65% over the last decade" ESA Space Environment Report 2026. Uncontrolled re-entries still happen and still carry uncertainty: the Aerospace Corporation's prediction service shows windows ranging from about an hour to nearly two days Aerospace CORDS. Most spacecraft break apart at 84 to 72 km altitude, with titanium and stainless-steel parts the most likely to survive to the ground NASA ODPO re-entry.
Breakups and compliance
Collisions grab headlines, but most new debris comes from things that break up on their own. Over the last two decades there have been on average 9.8 non-deliberate fragmentations per year, although 2025 added "a comparatively low number of fragments" from new events ESA Report I10R1.
The disposal record is uneven. Over the last decade, only 5 to 35% of payloads and 30 to 80% of rocket bodies complied with a five-year disposal standard ESA Report I10R1. The wide ranges reflect uncertainty about which objects were able to manoeuvre, but even the optimistic end leaves most payloads short.
The health index: 50 times over
The number that should anchor every conversation this year is ESA's environmental health index. It compares the projected long-term risk in LEO with a threshold ESA considers an acceptable first target. In the business-as-usual case, projected risk is "50 times higher than this acceptable first target threshold" ESA Report I10R1. ESA's own article notes that the index worsened by "an entire order of magnitude" in a single year, from about 4 to 50 ESA Space Environment Report 2026.
A caution for careful readers: an earlier revision of this year's report, published in May, carried a "4 times" figure. The September revision (Issue 10 Rev 1) is the authoritative version, and it is the one cited here.
ESA draws the conclusion plainly: "Active debris removal must become part of the solution and soon" ESA Space Environment Report 2026.
ClearOrbit's view
We read the 2026 report as the moment the debris problem stopped being a forecast and became an accounting fact. A catalog that has outgrown its own numbering system, three intact objects falling every day, and a health index that jumped more than tenfold in a year are not signals that can be managed with good intentions alone. Better disposal compliance is essential, and the rise in controlled rocket-body re-entries shows the industry can change quickly when it chooses to.
But compliance only slows the growth of new risk. It does nothing about the tonnes of derelict hardware already circling at altitudes where they will stay for centuries. That is why we agree with ESA that removal has to join mitigation, and why the timescale matters. The first capture-and-removal missions are planned for 2027 and 2028; the question for the rest of this decade is whether they become a repeatable service or remain one-off demonstrations.
We think the next step is shared, honest measurement: one public dashboard that shows catalog counts, modelled populations, re-entries and compliance side by side, with the source and date next to every figure. That is where we are starting, and it is the foundation for the removal roadmap we set out in our plan.
Reader mail
Have a better idea?Spotted something we got wrong?
We publish in public so the numbers can be checked. If a figure looks wrong, a source is missing, or you know something this piece should have said, send it over. One box, no sign-up.
Send an idea or correctionQuick question
Who should pay for cleaning up orbit?
Anonymous. You will see how others answered after you vote.
Sources
- ESA Space Environment Report 2026 (article)
- ESA Space Environment Report, Issue 10 Rev 1 (PDF)
- ESA DISCOS statistics
- ESA DISCOS 'By the numbers' (MASTER-8)
- CelesTrak SATCAT Boxscore
- CelesTrak NORAD elements
- CelesTrak GP data formats
- NASA Orbital Debris Quarterly News v30 i1-2
- NASA ODPO FAQ
- Jonathan McDowell, Starlink statistics
- Jonathan McDowell, constellation list
- Aerospace Corporation CORDS re-entry database
- NASA ODPO re-entry page